

TL;DR
Short, practical steps to inspect the Basket controller using the Symfony Profiler (dump) and Xdebug (step debugging).
Quick primer
- dump() / var_dump() — non‑fatal inspection; dumped values appear in the Web Profiler under the "Debug" panel. Use this for interactive checks.
- dd() — dump and die; stops execution and is destructive (use sparingly).
- Xdebug — step through code line by line in your IDE, inspect any variable at any point, no code changes needed. See Xdebug (step debugging) below.
Note: the Web Profiler / dump integration is only available in the dev environment. For CLI commands add --profile (e.g. ./scripts/symfony-console <command> --profile): the run is then stored as a profile, and its dump() output shows up in the Profiler under "Debug". Without --profile, dump() just prints to the console. Xdebug works for both.
Example: inspecting a controller variable
TIP
Foodsharing\Modules\Basket\BasketController::basket(int $id) is used below purely as an example. The same dump() approach works in any controller or service.
Goal
See what $basket contains.
Profiler (fast)
Add a temporary dump right after $basket is loaded in basket():
$basket = $this->basketGateway->getBasket($id);
dump($basket); // appears in Profiler -> "Debug"
dump('Second dump'); // multiple dumps are supported (e.g. dump($requests))
Reproduce: open /essenskoerbe/{id} in your browser and inspect the Profiler (Web Debug Toolbar → Profiler → Debug).
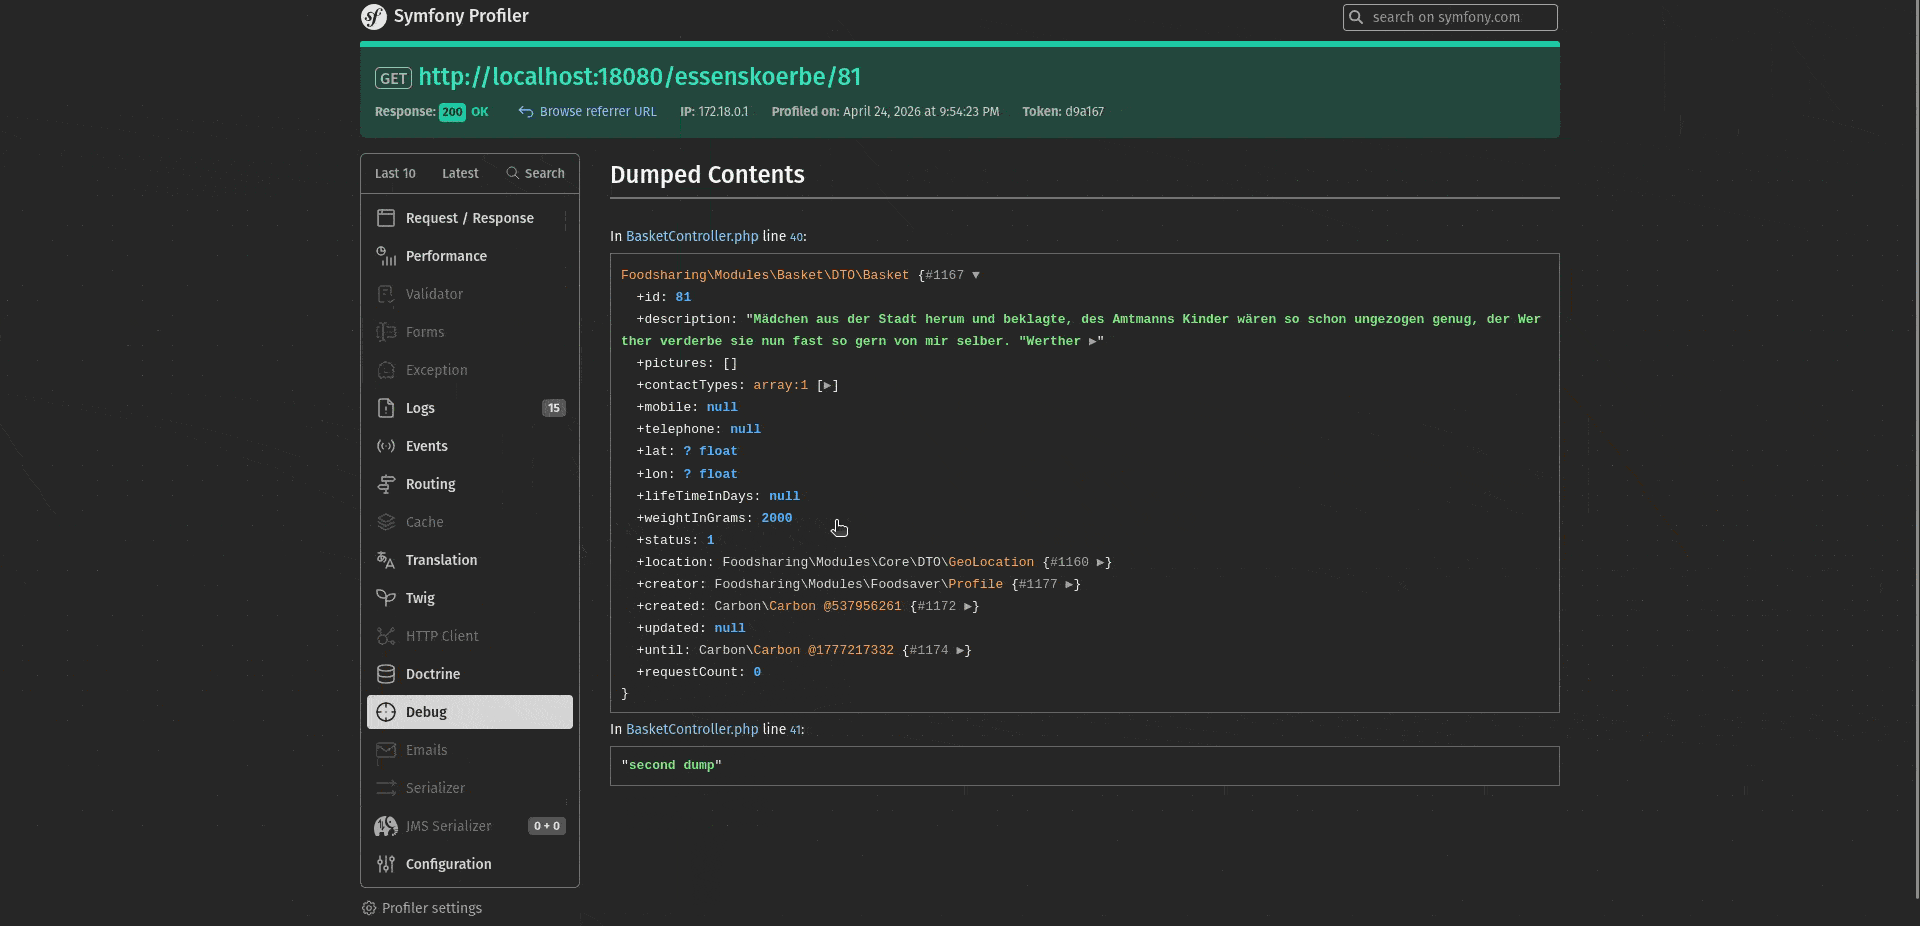
Click the ► markers to expand nested arrays and objects, e.g. contactTypes:
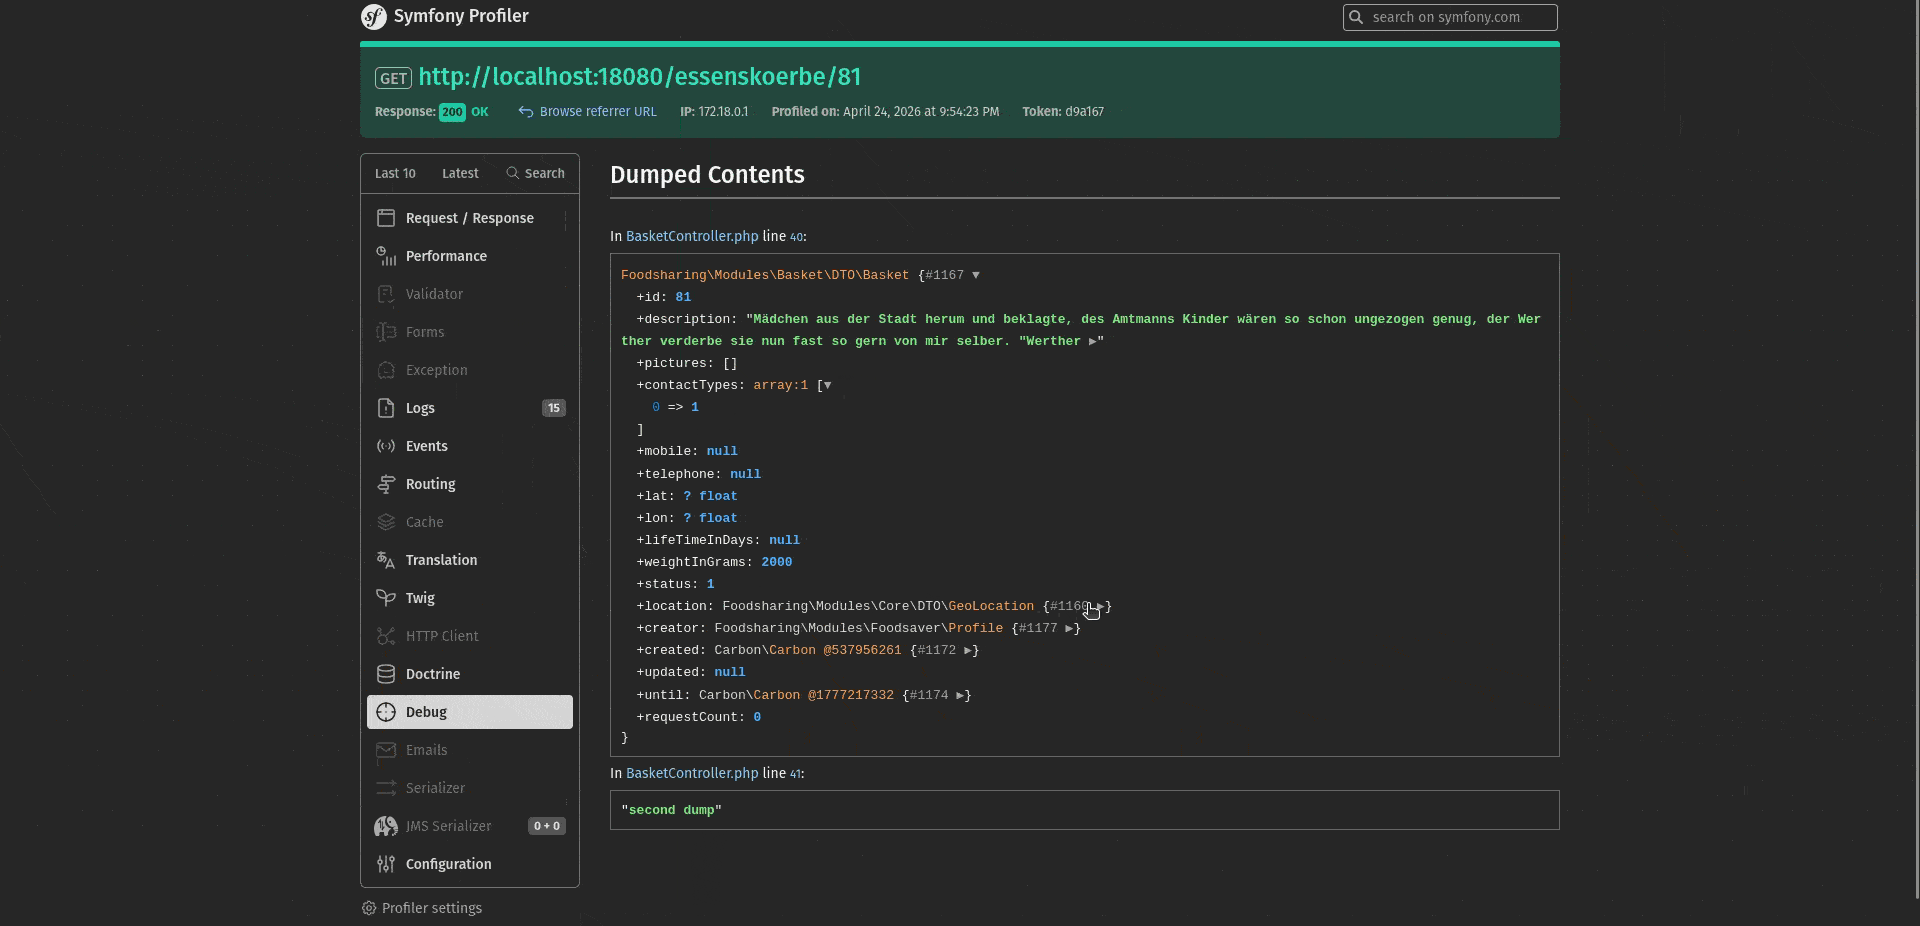
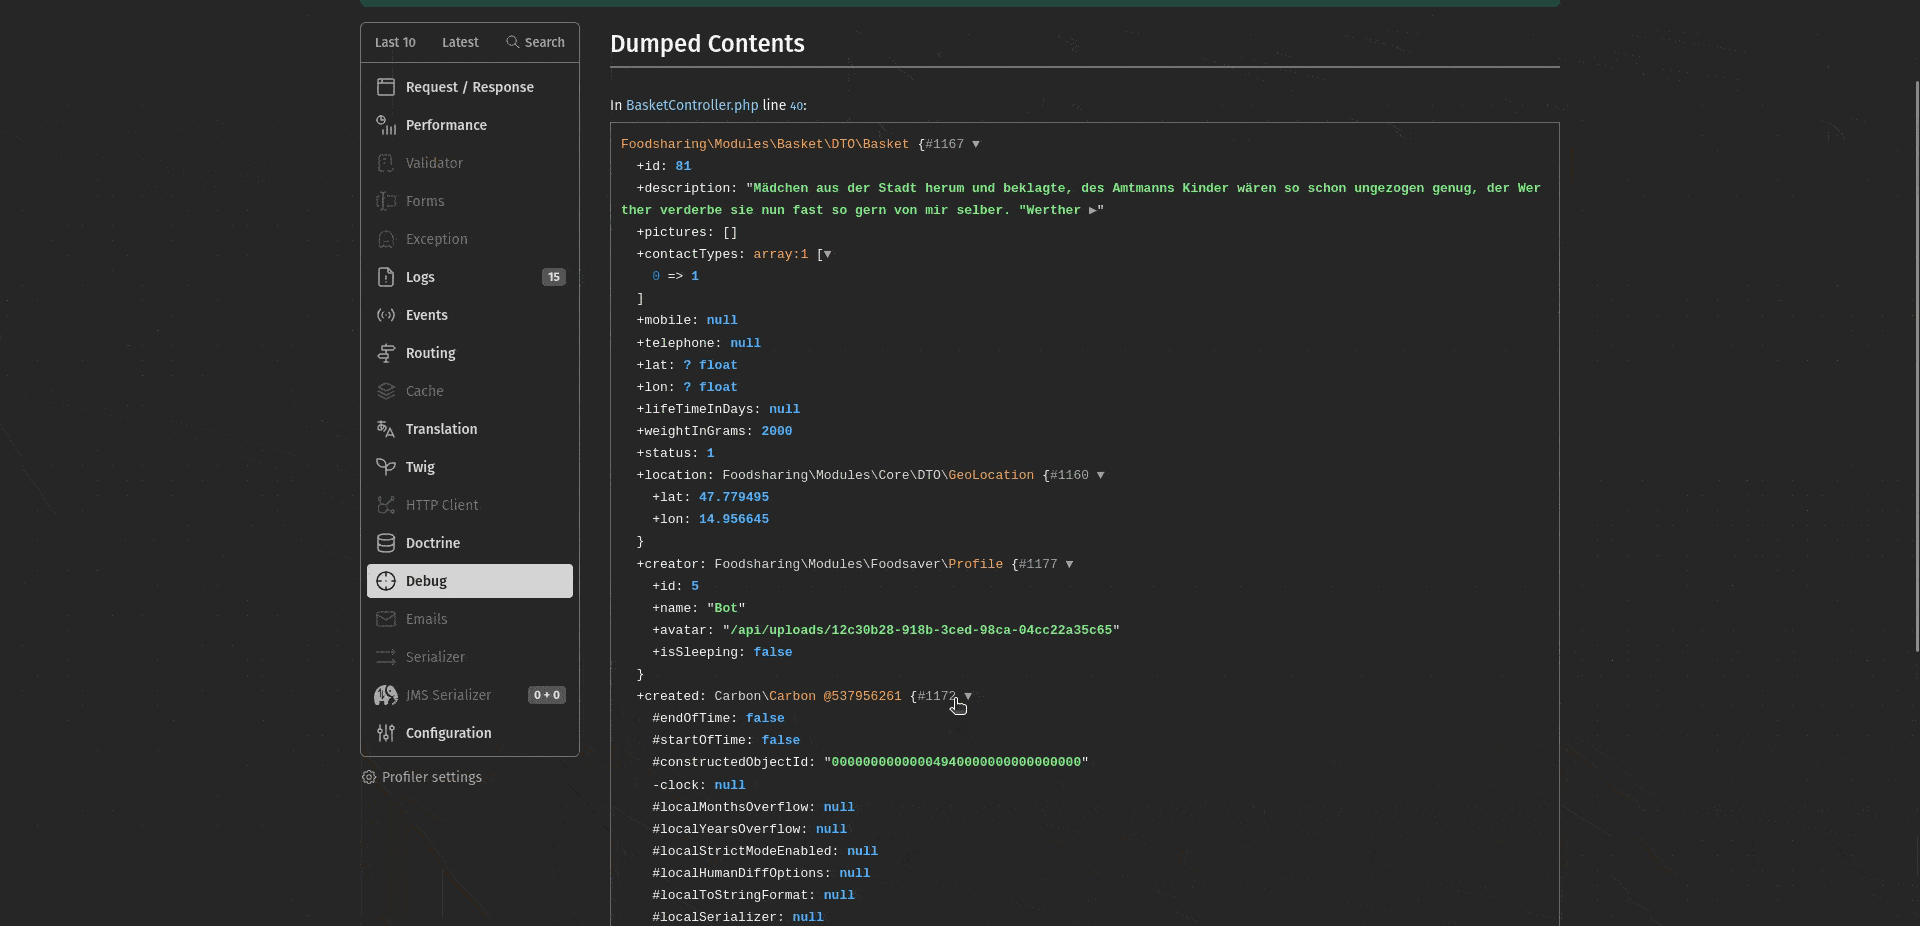
Nested objects like location and creator expand the same way:
dd() (dump and die)
Use dd() instead of dump() when you want to see the value immediately, without opening the Profiler — it prints the dump directly to the page and halts execution:
$basket = $this->basketGateway->getBasket($id);
dd($basket); // prints directly to the response and stops here
TIP
dd() sends an HTTP 500 response and never reaches the rest of basket() — the request never finishes normally, so nothing shows up in the Profiler for it. Use dump() if you still need the rest of the request to run.
Xdebug (step debugging)
Xdebug lets you set breakpoints in your IDE and step through the actual request line by line, inspecting every variable in scope — no dump() calls to add or remove. It's the right tool when you need to see how a value changes across several steps, not just what it looks like at one point.
TIP
Full setup (PhpStorm config, the trigger/extension, per-platform Docker networking notes) is documented once in IDE Setup → Xdebug — this section only covers when to reach for it.
Quick PhpStorm rundown
- Install the Xdebug Helper browser extension (Chrome/Firefox) — one click per tab to turn debugging on/off for that tab.
- In PhpStorm, click "Start Listening for PHP Debug Connections".
- Set a breakpoint in e.g.
BasketController::basket(), enable the extension, open/essenskoerbe/{id}. - PhpStorm stops at the breakpoint with the full variable scope, call stack, and step controls (step over/into/out).
Profiler/dump() vs. Xdebug — which one?
Profiler / dump() | Xdebug | |
|---|---|---|
| Setup per use | Add/remove a line of code | None — toggle the extension |
| Shows | One or a few values, at the point you placed them | Every variable in scope, at any line you step to |
| Following control flow | No — you only see what you explicitly dumped | Yes — step line by line, into function calls |
| Works for CLI / background jobs | Yes for commands started with --profile | Yes |
| Overhead when unused | None | None (this project uses mode=trigger — see IDE Setup) |
| Good for | "What does this variable look like right here?" — quick, no IDE setup needed | "Why does this branch/loop/value do that?" — following logic across multiple lines or calls |
In short: reach for dump() first — it's faster for a single "what's in this variable" question. Reach for Xdebug when you need to actually follow the code's path (which if branch was taken, why a loop ran N times, what an object looked like three calls up the stack) rather than inspect one snapshot.
Cleanup & quick rules
- Remove any
dump()/dd()immediately after debugging — do not commit them. - Dumping larger structures is fine since the output is ephemeral and only visible in the dev Profiler.
References
- Symfony Profiler: https://symfony.com/doc/current/profiler.html
- VarDumper: https://symfony.com/doc/current/components/var_dumper.html
- Xdebug: https://xdebug.org/docs/step_debug
- IDE Setup → Xdebug — PhpStorm configuration for this project